

You open your site on your phone on mobile data, the way most visitors do, and you stare at a blank white screen for a few seconds too long. Or a customer messages you on WhatsApp to say your product page never finished loading. The frustrating part is that “why is my website slow” has at least eight different possible answers, and the fix for one is often useless against another.
This guide gives you a way to find out which one applies to your site before you touch anything. Measure first, then fix in the order that actually moves the needle, instead of installing three caching plugins and hoping one of them helps.
Measure Before You Fix Anything
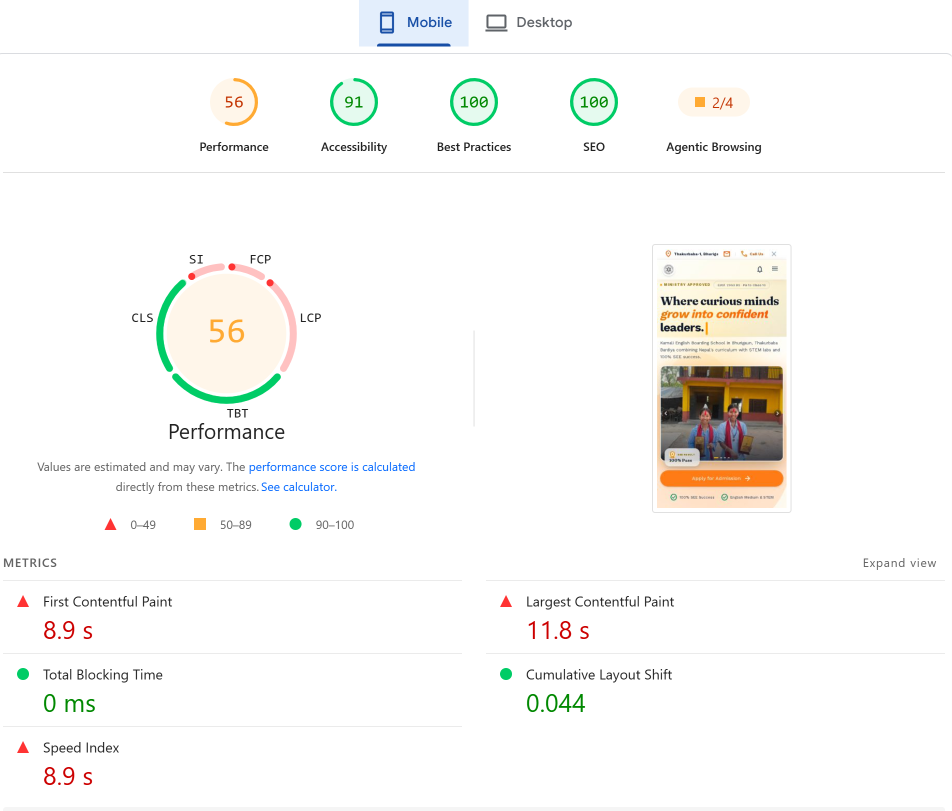
Guessing wastes time, and the fix for a 3-second server response time is completely different from the fix for a 4 MB hero image. Before changing anything on your site, run it through Google PageSpeed Insights on both mobile and desktop. It reports two things: lab data (a simulated test run right then) and field data (how real visitors using Chrome actually experienced your site, when there is enough traffic to show it).
Pay attention to three numbers, known together as Core Web Vitals:
| Metric | What it measures | Good | Poor |
|---|---|---|---|
| Largest Contentful Paint (LCP) | How long until the main content appears | 2.5 seconds or less | Above 4 seconds |
| Interaction to Next Paint (INP) | How quickly the page responds to a tap or click | 200 milliseconds or less | Above 500 milliseconds |
| Cumulative Layout Shift (CLS) | Whether the layout jumps around while loading | 0.1 or less | Above 0.25 |
Google measures these at the 75th percentile of real visits, so a page only counts as good when three out of four visitors actually get that experience, not just your own test run on office WiFi.
Two more numbers are worth writing down before you start:
- Time to First Byte (TTFB): how long the server takes to send the very first piece of the page, before the browser has anything to render at all. If this alone is high, no amount of image or plugin work will fix it. The problem is on the server.
- Total page weight and request count: open Chrome DevTools, go to the Network tab, reload the page, and look at the total size and how many separate files it downloaded. A page under roughly 2 MB with a reasonable number of requests loads acceptably on most connections. A page well past that, especially one dragging in 30 to 40 requests for a single view, has real weight to cut.
Run the test three times and on both a fast connection and a throttled “Slow 4G” profile in DevTools, since a single run can be skewed by a temporary spike. Once you know where the time is actually going, the sections below tell you what to do about it.
Cause 1: Slow Server Response Time
If your TTFB is consistently above 600 to 800 milliseconds, the server is the bottleneck, and nothing you do to the page itself will fix that first delay. Three things commonly cause this on shared hosting:
- The plan is genuinely undersized for the traffic. Shared hosting splits CPU and memory across every account on the server. If your WooCommerce store now gets real daily traffic, or a neighboring account on an older, non-isolated setup is heavy on resources, your response time suffers along with it. CloudLinux with CageFS is the specific technology that prevents one noisy account from dragging down others on the same server, so it is worth asking your host directly whether they run it.
- PHP is running an old, slower version, or OPcache is off. PHP 8.x is meaningfully faster than PHP 7.x for typical WordPress workloads. Most cPanel hosts expose a PHP version selector in the control panel, and switching is usually a dropdown, not a migration. Test your site immediately after switching, since an old plugin can occasionally break on a newer PHP version.
- Redirect chains add round trips before the real response even starts. HTTP to HTTPS to www to a trailing slash- each hop adds latency before the browser has anything. Check by fetching your homepage URL directly and seeing whether it redirects more than once; if it does, fix your
.htaccessor WordPress site URL settings to land on the final address in one hop.
Fix: confirm your host’s server-side stack (LiteSpeed vs Apache, PHP version, whether the account is isolated from others), then request a PHP version upgrade if you are behind. If TTFB stays high after that on shared hosting during normal, non-spike traffic, a VPS or cloud hosting plan with dedicated resources is the more honest fix, not another plugin.
Cause 2: No Caching
Without caching, your server rebuilds the full page (database queries, PHP logic, template rendering) on every single visit, even when the content has not changed since the last request. Caching stores a ready-made copy and serves that instead, which is often the single biggest speed gain available for a WordPress site.
There are two layers worth knowing about:
| Layer | What it does | Common tool |
|---|---|---|
| Page cache | Stores a full HTML copy of a page so PHP and the database are skipped entirely on repeat visits | LiteSpeed Cache, WP Rocket, W3 Total Cache |
| Object cache / OPcache | Caches database query results or compiled PHP so the server does not repeat the same work internally | Redis or Memcached for objects, OPcache for PHP itself |
If your hosting runs on LiteSpeed, the LiteSpeed Cache plugin (LSCache) is server-level, generally faster than a purely PHP-based caching plugin, and free. Run only one page caching plugin at a time. Two caching plugins fighting over the same job is a real, common cause of a site that behaves inconsistently rather than one that is simply fast.
One caution that applies to WooCommerce sites specifically: cart, checkout, and account pages must be excluded from page caching, or customers can see a stale cart, someone else’s session, or a broken checkout. Every major caching plugin has a setting for this. Check it before you enable caching site-wide, not after a customer reports a problem.
Fix: install one caching plugin matched to your server (LiteSpeed Cache if you are on LiteSpeed), exclude dynamic pages like cart and checkout, and re-test with PageSpeed Insights afterward to confirm TTFB actually dropped.
Cause 3: Unoptimized Images
On most pages, an image is also the Largest Contentful Paint element, so heavy, unresized images push your LCP score up directly. This is a large enough topic that it has its own full guide: 7 Easy Ways to Optimize Images for Faster Loading covers formats, resizing, compression, lazy loading, and responsive srcset images step by step.
The short version, if images are the reason you landed on this page:
- Resize before uploading to match how wide the image actually displays, not your phone’s full resolution.
- Convert to WebP for the 25 to 35 percent size reduction over an equivalent JPEG.
- Never lazy-load the image above the fold. Lazy-loading your LCP image is one of the more common self-inflicted causes of a poor LCP score, since it forces the browser to wait before fetching the one image the metric is timing.
- Always set
widthandheightattributes so the browser reserves space before the image loads, which prevents the layout shift that hurts your CLS score.
Cause 4: Too Many Plugins and a Heavy Theme
Every plugin you install can add its own CSS, JavaScript, and database queries to every page load, whether or not that page actually uses the plugin’s feature. A contact form plugin loading its scripts on every page of your site, including ones with no form, is a common and completely avoidable cost.
Heavy page builders (Elementor, Divi, and similar drag-and-drop tools) generate deeply nested markup and often load their own CSS and JS frameworks on top of your theme’s. They are genuinely productive to build with, and the tradeoff is real: pages built with them tend to ship more code per page than a simpler, handcrafted template.
Fix:
- Deactivate any plugin you cannot immediately justify. If the site still works and looks right, leave it off.
- Test the effect of a “heavy” plugin (a page builder, an all-in-one SEO suite, a slider) by disabling it and re-running PageSpeed Insights before and after, on the same page, rather than guessing at the impact.
- If your site is a WordPress blog or brochure site without complex layout needs, a lightweight theme carries far less baseline weight than a full page-builder theme, and is worth considering if you are rebuilding from scratch.
Cause 5: Render-Blocking CSS and JavaScript
When a browser reads your page’s HTML and hits a <script> tag or a <link rel="stylesheet"> in the <head>, it stops rendering anything further until that file downloads and, for scripts, finishes running. A page with several such files in the head delays the very first paint, even if the server responded instantly.
The usual fixes: add defer to scripts that do not need to run before the page paints, and async for independent scripts like analytics that do not depend on page content. Neither attribute is safe to add blindly to every script; a script that manipulates the DOM before other scripts load can break if you defer it carelessly, so test after changing this, not just before.
This is one of the areas where the fix genuinely depends on your setup. Many performance plugins (LiteSpeed Cache and WP Rocket both have this feature) offer automatic CSS and JS optimization, including deferring non-critical scripts and inlining critical CSS, with a toggle in their settings rather than hand-editing template files. If you are not comfortable editing theme files directly, start there before touching code.
Cause 6: A Bloated Database
WordPress accumulates post revisions, spam comments, expired transients, and orphaned metadata in its database over time. None of this is visible on the front end, but every query your theme or plugins run has to search through more rows than necessary, which slows down page generation, particularly on dynamic pages like search results or a WooCommerce shop page.
Fix: clean the database periodically, either through a plugin like WP-Optimize or Advanced Database Cleaner, or by using phpMyAdmin (available in cPanel on most shared hosting) to run the built-in “Optimize Table” function on your WordPress tables directly. Do this occasionally, not as a one-time fix; the same bloat accumulates again over months of normal use.
Cause 7: No CDN, or a Server Far From Your Visitors
This is where Nepal-specific hosting choices genuinely change the picture, and it is also where a lot of generic speed advice stops being useful. Physical distance between your visitor and your server adds real, unavoidable latency: every request has to travel there and back before anything happens.
If almost all of your visitors are in Nepal, a Nepal-based server has a real latency advantage over a server in the US or Singapore, something we covered in more detail in Nepal VPS Hosting vs International VPS. A CDN (content delivery network) solves a different, complementary problem: it caches your static files, like images, CSS, and JS, on servers spread around the world, so a visitor anywhere gets those files from a nearby edge location instead of your origin server every time. Cloudflare’s free tier is the most common starting point and is straightforward to set up by pointing your domain’s nameservers to it.
Fix: if your audience is mostly local, confirm your hosting is actually on a Nepal-based server rather than assuming it. If you also get meaningful traffic from outside Nepal, a free-tier CDN in front of your static assets closes that gap without changing your primary hosting.
Cause 8: Third-Party Scripts
Live chat widgets, Facebook Pixel, Google Analytics, embedded YouTube videos, and similar third-party embeds run code you do not control on every visit. Each one adds its own network requests and can hold up the main thread, which shows up specifically as a poor INP score even on pages that load quickly overall.
Fix: audit what is actually installed. It is common to find analytics or a chat widget that was added for a launch and never removed. For the ones you keep, delay non-critical scripts (analytics, most tracking) until after the page is interactive, and consider a click-to-load facade for heavy embeds like an embedded YouTube video, so the full player only loads when a visitor actually clicks it.
So Why Is My Website Slow? Match Your Symptom to a Cause
Use this as a starting point, not a diagnosis. Confirm with PageSpeed Insights and the Network tab before committing to a fix.
| What you see | Likely cause | Where to look |
|---|---|---|
| Blank screen for a few seconds, then everything appears at once | Slow server response or no caching | Cause 1, Cause 2 |
| Text and layout show fast, but images crawl in afterward | Heavy, unoptimized images | Cause 3 |
| One specific page is slow, the rest of the site is fine | A plugin, a heavy embed, or a large image only on that page | Cause 4, Cause 8 |
| Page loads but feels laggy when you tap a button or open a menu | Blocking JavaScript, usually from a third-party script | Cause 5, Cause 8 |
| The whole site got slower gradually over months; nothing obvious changed | Database bloat, or growth past your hosting plan’s limits | Cause 6, Cause 1 |
| Fast for you in Kathmandu, visibly slower for visitors elsewhere, or vice versa | Server location, missing CDN | Cause 7 |
What Usually Does Not Help
- Installing a second or third caching plugin “just in case.” Caching plugins commonly conflict rather than stack, and the usual result is a site that behaves unpredictably, not one that is measurably faster.
- Deferring every single script indiscriminately. Some scripts genuinely need to run early. Test after changing this rather than assuming more deferred scripts is always better.
- Upgrading your hosting plan before measuring. If your TTFB is already fast and the real cost is 15 MB of unoptimized images, a bigger server will not fix that, and you will have paid for resources you did not need.
Conclusion
A honest answer to why is my website slow rarely has one single cause, but it almost always has one dominant cause for your specific site, and that is the one worth finding first. Run PageSpeed Insights, check your TTFB and total page weight, and match what you see against the symptom table above before changing anything. Fix the server-side issues first if TTFB is high, since nothing else matters until the first byte arrives quickly; then work through images, caching, and the rest in whatever order your specific test results point to.
If you have gone through this list and your server response time is still consistently slow during ordinary, non-spike traffic, that is usually a sign you have outgrown your current hosting plan rather than a sign you are doing something wrong. Hosting provider like Kailash Cloud’s shared hosting runs on LiteSpeed with NVMe SSD storage, and its VPS and cloud plans are there for sites that need dedicated resources.
Frequently Asked Questions
Why is my website slow?
Usually one of eight things: a slow server response, no caching, unoptimized images, too many plugins, render-blocking scripts, a bloated database, server distance from your visitors, or heavy third-party scripts. Run PageSpeed Insights first to see which one applies to your site rather than guessing.
What is a good website loading time?
There is no single universal number, but Google’s Largest Contentful Paint threshold of 2.5 seconds or less is the most widely used benchmark for “fast enough,” measured at the 75th percentile of real visits rather than a single test run.
How do I check why my website is slow?
Start with Google PageSpeed Insights for both mobile and desktop, note your LCP, INP, CLS, and TTFB, then open Chrome DevTools’ Network tab to see total page weight and which specific files are largest. That combination points you toward server issues, image issues, or script issues before you change anything.
Is shared hosting too slow for a WordPress site?
Not inherently. Shared hosting on a modern stack (LiteSpeed, NVMe SSD, CloudLinux isolation) handles the large majority of blogs, portfolios, and small business sites comfortably. It becomes the limiting factor specifically when your traffic or plugin load consistently exceeds what your plan allocates, not simply because it is shared.
Do I need a CDN if my visitors are mostly in Nepal?
Less urgently than a site with a global audience. A CDN mainly helps visitors far from your server. If your traffic is overwhelmingly local and your server is already Nepal-based, a CDN adds a smaller improvement than it would for an international audience, though it is still useful if you get meaningful traffic from outside Nepal.
Can too many plugins really slow down my site?
Yes, particularly plugins that load their own CSS or JavaScript on every page regardless of whether that page uses the feature. The number of plugins matters less than what each one actually loads and where.
Will upgrading my hosting plan automatically fix a slow site?
Only if the server itself is the bottleneck. If your TTFB is already fast and the real cost is unoptimized images or a bloated database, a bigger plan will not fix those, but if you upgrade from shared hosting to cloud hosting or VPS then, it can fix some problems like TTFB.
What is the difference between LCP and page load time?
Page load time (or the older “onload” event) waits for everything on the page, including things a visitor never notices, like an analytics script finishing in the background. LCP specifically measures when the main visible content appears, which more closely matches what a visitor actually experiences as “the page is ready.”
How often should I re-check my site’s speed?
After any meaningful change: a new plugin, a theme update, a redesign, or a jump in traffic. Speed is not something you fix once. A page that passed Core Web Vitals six months ago can regress quietly as content and plugins accumulate.